


The Issue:
The United States experienced a large run-up in house prices in the first half of the 2000’s which was followed by a dramatic fall in the second half of that decade. The fall led to a sharp drop in wealth for American households and had broad implications for the stability of many of the country's financial institutions, for the U.S. economy, and for economies in other countries as well.
The Facts:
- There is good reason to pay attention to the housing cycle. Housing equity is a significant percentage of household wealth in the U.S, but it has shown substantial variability. It peaked at over a fifth of household wealth, 21.4 percent, in the 4th quarter of 2005 and was down to a trough of 9.6 percent in in the 2nd quarter of 2011, according to data from the Board of Governors of the Federal Reserve System, which goes back to 1945. Housing wealth has a large and significant effect on household consumption and this effect is larger than that of stock market wealth. Prior to the Great Recession, eight out of the ten recessions since World War II were preceded by a downturn in the housing sector (see here).
- Average house prices in the United States have risen sharply since the depths of the Great Recession. Real national house prices were constant between 1980 and 1998, then rose by nearly 50 percent by 2006 and bottomed out in 2012, after an almost 30 percent drop. Since then, prices have recovered at the national level by nearly 25 percent (see top chart). To put the rise and fall in house prices associated with the Great Recession in historical perspective, the rise in prices was not unprecedented — a similar percent rise took place in an even shorter time-period between 1942 and 1947. On the other hand, the last time a comparable drop in prices over a 6-year period occurred was a 25 percent fall between 1915 and 1921 (see here for a historical house price series).
- Does the recent rise in national house prices indicate another peak and downturn in the housing cycle may be coming soon? While predicting the timing of turning points for housing prices is notoriously difficult, several current factors are very different from the conditions that preceded the previous downturn. Consider the following data comparing the recent bubble to the current situation. The rise in national house prices between 1998 and 2006 was accompanied by a commensurate rise in building permits which peaked just prior to the peak in house prices (see the solid gray line in the chart above). This is consistent with a housing bubble where prices rise even though new housing supply increases substantially; an indication of over-building (which was most significant in the Sand States; Arizona, California, Florida, and Nevada). The crash in prices also witnessed a crash in building permits. Permits have recovered ahead of prices but now are well below their peak in 2005. It is also the case the current house sales are well below their peak at the height of the housing market cycle in 2005 (see here).
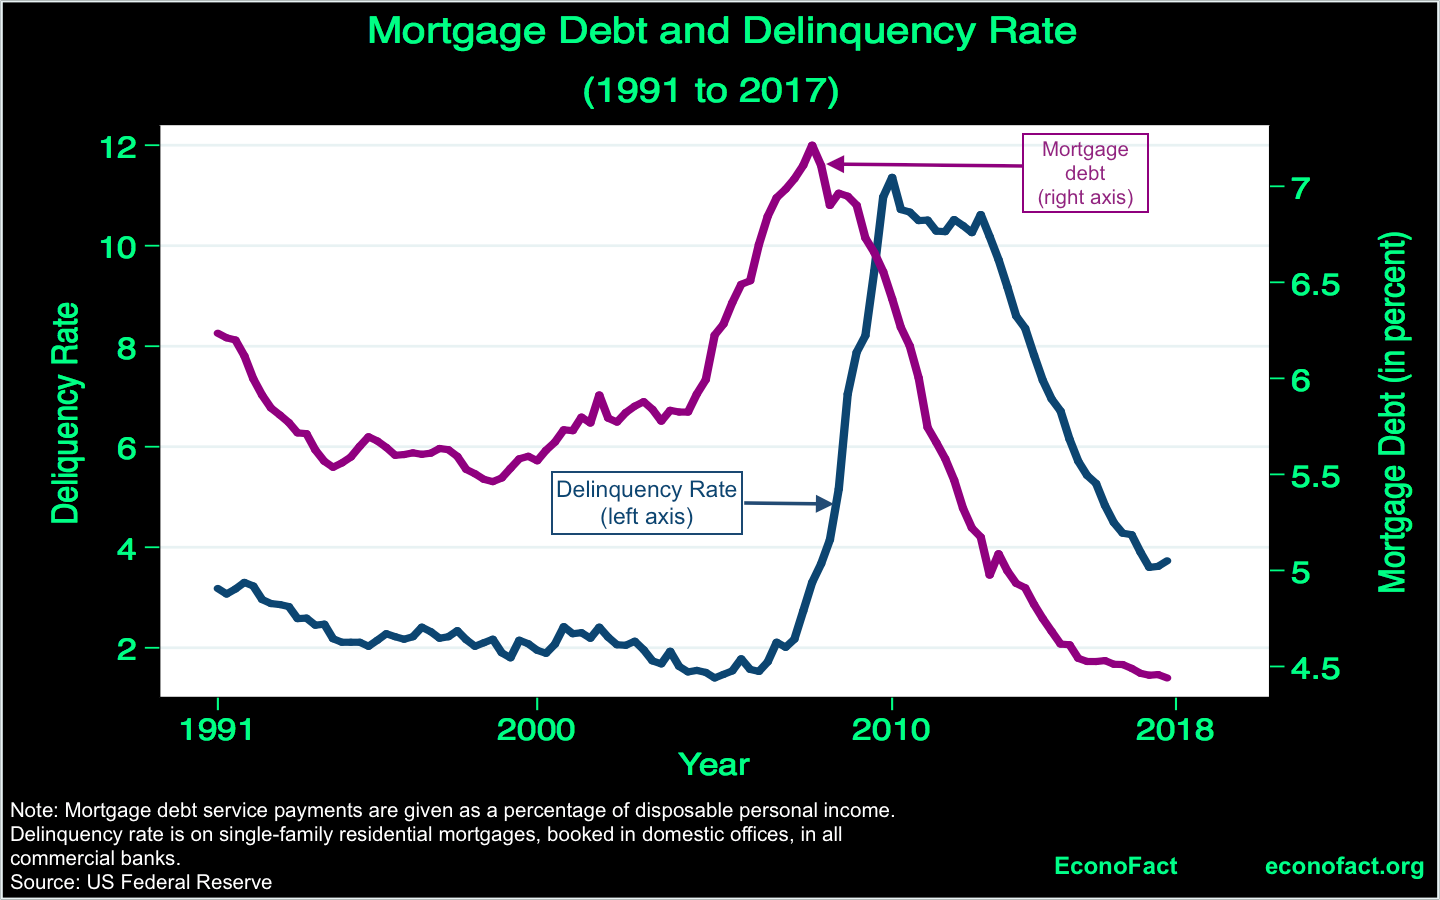
- While many families were struggling to make their mortgage payments just before the Great Recession, debt to income levels and delinquency rates are currently much lower than they were prior to the bust. Households are holding significantly less mortgage debt and are making their monthly mortgage payments at a much higher rate than during the Great Recession. In 2018, quarterly mortgage debt service payments as a percent of disposable personal income, which gives a measure of how cumbersome mortgage debt is for individuals, was significantly below the peak reached during the last housing crash. The delinquency rate on single-family residential mortgages was also significantly below the peak during the last housing crash.
- However, national averages mask starkly different house price trends in cities across the country. The changes in house prices experienced by different cities present some marked contrasts. In San Francisco, for instance, house prices increased by 186 percent between 1980 and 2006, then fell by 32 percent by 2012, and, in 2018, were more than 230 percent above 1980 values. In contrast, prices in Las Vegas were generally at or below 1980 values until 2003 and then rose by 65 percent by 2006 before plunging by 65 percent by 2012. As a result, housing prices in Las Vegas in 2018 were barely above those in 1980. House prices in Cleveland have shown relatively little variation over this time-period but, in 2018, were nearly 20 percent below 1980 values (see top chart). More generally, studies that look across large populations clusters such as cities and their surrounding densely settled areas, known as Metropolitan Statistical Areas (MSAs) document these diverging trends. Between the second quarter of 2012 when the national house price index bottomed out and the first quarter of 2018, real prices increased by 16 percent on average in 403 MSAs. Of these Metropolitan Statistical Areas, 360 experienced average price increases with the maximum change being 68 percent in Reno, Nevada. The largest decline was 10 percent in Farmington, New Mexico, according to data from the Federal Housing Finance Agency. Similarly, a different study of 94 Metropolitan Statistical Areas finds that the start of the recent housing boom began at different points in different MSAs over a ten-year period from 1995-2006.
